

slide:ology, by Nancy Duarte, should be required reading for every high school and college student, and anyone in the workforce who has to do a presentation. If you find the approach Duarte advocates too much work, please retire as soon as possible. The world will be a better place.
slide:ology practices what it preaches. Acknowledgements are presented in a visual map (pp. viii-ix). The history of visual aids is presented as a timeline (pp. xiv-xv). The index (pp. 264-274) is remarkably complete and easy to navigate. The first and last chapters are bookends, reminding the reader to create presentations from the point of view of the intended audience.
In the first chapter, “Creating a New Slide Ideology,” Duarte encourages presenters to realize, “the audience members care solely about what the presenter can do for them.” (p. 10) The corollary is, “good presenters aren’t in it for themselves; they’re in it for others.” (p.14) The final chapter, “Manifesto,” concludes with five theses of the power of a presentation (pp. 253-261). “1) Treat your audience as king. 2) Spread ideas and move people. 3) Help them see what you are saying. 4) Practice design, not decoration. 5) Cultivate healthy relationships.”
The chapters are an inspiring blend of narrative, examples, case studies, and tips, augmented by supporting content on the book’s Web site, www.slideology.com. For example, along with the narrative explaining the presentation ecosystem (p. 10), there is an image representing the components of and relationships between message, visual story, and delivery (p. 11). The case study on Creating Great Presence (pp. 18-19) quotes Rick Justice (Executive Vice President, Cisco Systems), “Presenting…[is] about creating meaning. It’s about being present. I need to ensure that every person in the audience believes I am having an individual conversation with them. That is my goal.” The case study explains how Rick Justice does that.

Bad slides and bureaucracy seem to go hand in hand. This screen, from a PowerPoint presentation by the Multi-State Information Sharing and Analysis Center, has many of the elements of a classic bad slide: two logos (in case you forget from slide to slide who is doing the presentation), a photo (in case you aren’t clear on who is speaking), a difficult to read, multicolor, 3D piece of text at the bottom, and too much text with poor contrast. (http://www.msisac.org/webcast/) Click on image to view full-sized.
In “Creating Ideas, Not Slides,” the narrative states, “Sticky notes allow ideas to be captured, sorted, and re-arranged as needed” (p. 28). The associated tip is, “When brainstorming, don’t settle for the first solution. Think through multiple alternatives. Don’t be stingy with sticky notes.” (p. 28) The illustration shows a person adding to a wall covered with color-coded sticky notes. The case study on Using Images Worth a Thousand Words (pp. 36-37) provides three strategies Mitchell Baker (Chairman, Mozilla) uses for cross-culture communication. “1) Use images that are culturally neutral. 2) Keep graphics extremely simple. 3) Connect with your audience.” Having generated several ideas, the destructive aspect of the creative process is to throw away all the brainstorming ideas except one. The critical success factor is to “focus on whatever works best, not the idea that is easiest to execute.” (p. 40)
Developing that theme in “Creating Diagrams,” diagrams are used to explain how parts of a whole interact (p. 44). According to Duarte, complex relationships take time and thought to develop, but in the end “individual concepts become imbued with context, sequence, and association.” (p. 60)
In “Displaying Data,” there is one principle above all others: clarity. Data slides are not about showing all the data, they are about the meaning of the data. Slides are not a good medium for showing complex data. Duarte advocates distributing complex data as a handout. Show data in a way that illustrates your conclusion. Five data slide rules help you present your data clearly (p. 65): “1) Tell the truth. 2) Get to the point. 3) Pick the right tool for the job. 4) Highlight what’s important. 5) Keep it simple.” Integrity is essential for credibility, so avoid decorating the data (p. 66). “[A]rticulate the conclusions you want your audience to adopt.” (p. 68) A helpful tip is, “When several slides in a row have charts, line up the axes of the charts from slide to slide to avoid content that jumps around.” (p.70) Another tip covers how to present a pie chart (p. 71). Keep data slides free of clutter; simplicity is important when displaying data for projection (p. 74).
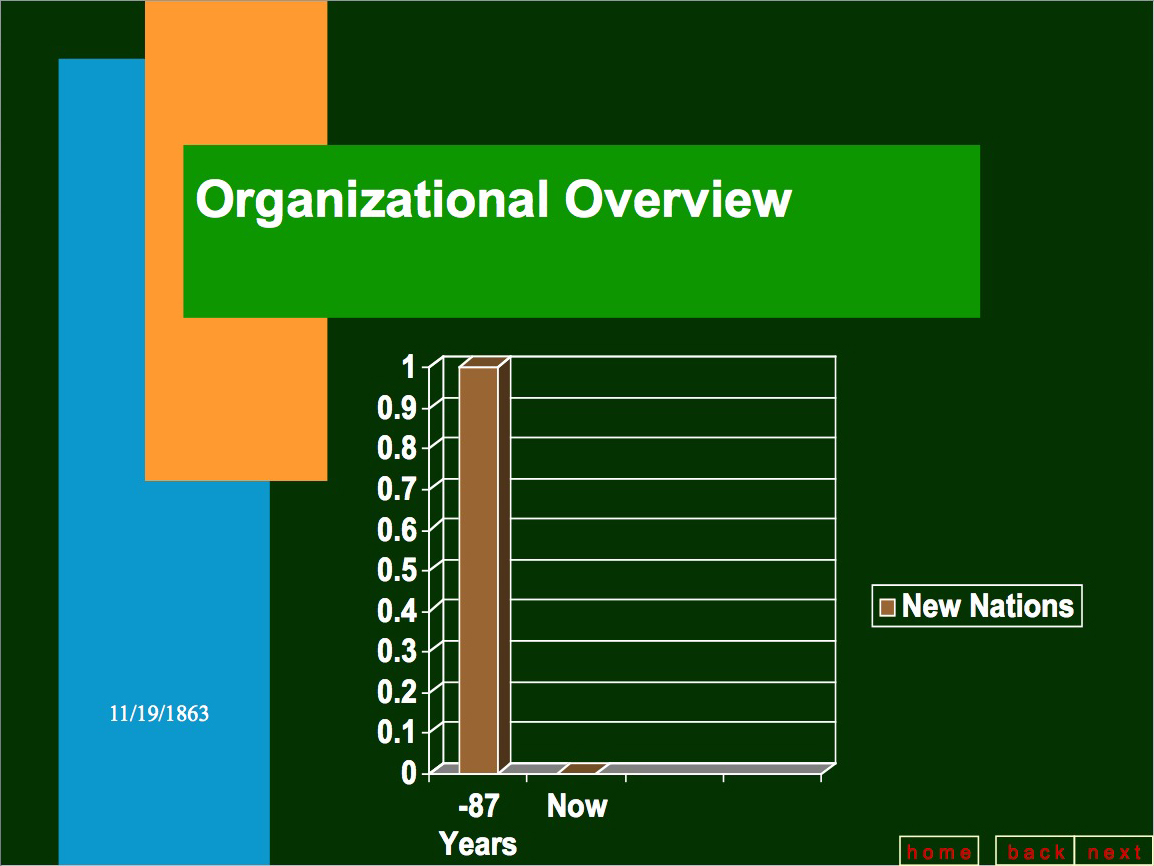
Peter Norvig created “The Gettysburg PowerPoint Presentation” in response to “one too many bad presentations.” Best known as director of research for Google, this slide is PowerPoint’s graphical representation of “four score and seven years ago.” (http://www.norvig.com/Gettysburg/) Click on image to view full-sized.
“Thinking Like a Designer” makes the point that design is about solving problems. Designers “focus on the experience, making it as beautiful and memorable as possible.” (p. 83) Instead of using adjectives to describe an organization, Duarte encourages readers to define their organization by selecting a few verbs that resonate. The list provided (p. 85) is fascinating. The verbs selected express what you do and for whom you do it. Design decisions influence your audience’s perception of who you are. To design effective slides, think of them as a signal. “Strength and clarity determine how well information is conveyed.” (p. 88) The three elements that determine strength and clarity are arrangement, visual elements, and movement. If these elements are not used to facilitate a person’s ability to process information efficiently and effectively, the signal becomes noise, interfering with the message. Audiences tune out a garbled message.
“Arranging Elements” illustrates how to maximize clarity by employing contrast, flow, hierarchy, unity, proximity, and whitespace. These are the tools of slide design. It is critical to make a decision about the priority of the information. “[D]etermine which visual elements should have prominence so they attract attention first.” (p. 93) Audiences need contrast to focus their attention. “Unintentional contrast can confuse the intended message at best, and contradict it at worst.” (p. 95) Ordering how the information is processed guides the audience’s eyes through the content, whether it is text, diagrams, or images. A tip on page 97 gives five ways to order how information is processed. Visual structure establishes the parent-child relationship, revealing their relative importance. “If you don’t intentionally provide that message, the audience will create meaning based on their own interpretation of the information.” (p. 99)

Science Interactive, Ltd., is a UK company that “designs, builds and sells PowerPoint based software to support both teachers and pupils.” From the distorted images, multi-colored text, and sheer quantity of text, the students and teachers may need far more support. (http://www.science-interactive.co.uk/) Click on image to view full-sized.
Duarte recommends a flexible way to organize content through use of a grid system to structure information. To focus attention on specific elements, make an exception and break the grid. Placing elements associated with each other intentionally will preempt the audience from making unintended interpretations. “[P]ay equal attention to how much space you leave open…the use or misuse of whitespace determines a slide’s effectiveness. [C]lutter is a failure of design.” (p. 106) “[R]emove everything on a slide that doesn’t bring emphasis to your point.” (p. 111)
“Using Visual Elements: Background, Color, and Text” covers best practices to use when determining these three elements. Consistency is the key, although breaking consistency can create a visual emphasis if used as a rare exception. Duarte makes a valid point about the use of a logo. “The people who have come to hear you speak most likely know who you work for. Use your first and last slides (called bumper slides) to identify yourself or company.” (p. 117) The comment about the boss who insists you put the logo on every slide is priceless.
Duarte’s observation that backgrounds are a surface on which to place elements, not a work of art, would also be a revelation for many organizations. Useless ornamentation around the edges, meaningless graphical elements, and backgrounds that compete with content make an ineffectual slide template. Graphics exist in either a 2D (flatland) or 3D (shadows, lighting, and depth) space. Pick one. If you use 3D, follow the three laws of environmental consistency: 1) consistent vanishing point; 2) consistent light source; and 3) consistent effect on the elements. (p. 120)
Color is crucial to your presentation, so select colors that appeal to your target audience, ensure you stand out in your field, and reflect your personality. Duarte has an extensive discussion about how to choose your background color and your color palette (pp. 128-139). The tip on page 135 reminds you to carefully consider contrast when choosing your palette.
Text should follow the three-second rule: your audience can effectively process your message within three seconds. “The audience should be able to quickly ascertain the meaning before turning their attention to the presenter.” (p. 140) Typesetting decisions make the difference between appearing as a novice or as a master. Duarte advocates taking as much care about the treatment of type as you take in your concept, copy, images, and layout. “Choose a font that accurately reflects the personality of your brand.” (p. 142) Using the analogy of billboards, Duarte argues that presentations are “glance media.” In the debate over which type of font (serif or sans serif) is most suited for legibility “If…slides are most comparable to billboards, then sans serif is the way to go.” (p. 143) “It is best to combine no more than two fonts per presentation. Use one font for headlines and subheads, and the other for blocks of text.” “[U]se color or italics to create emphasis.” (p. 143)
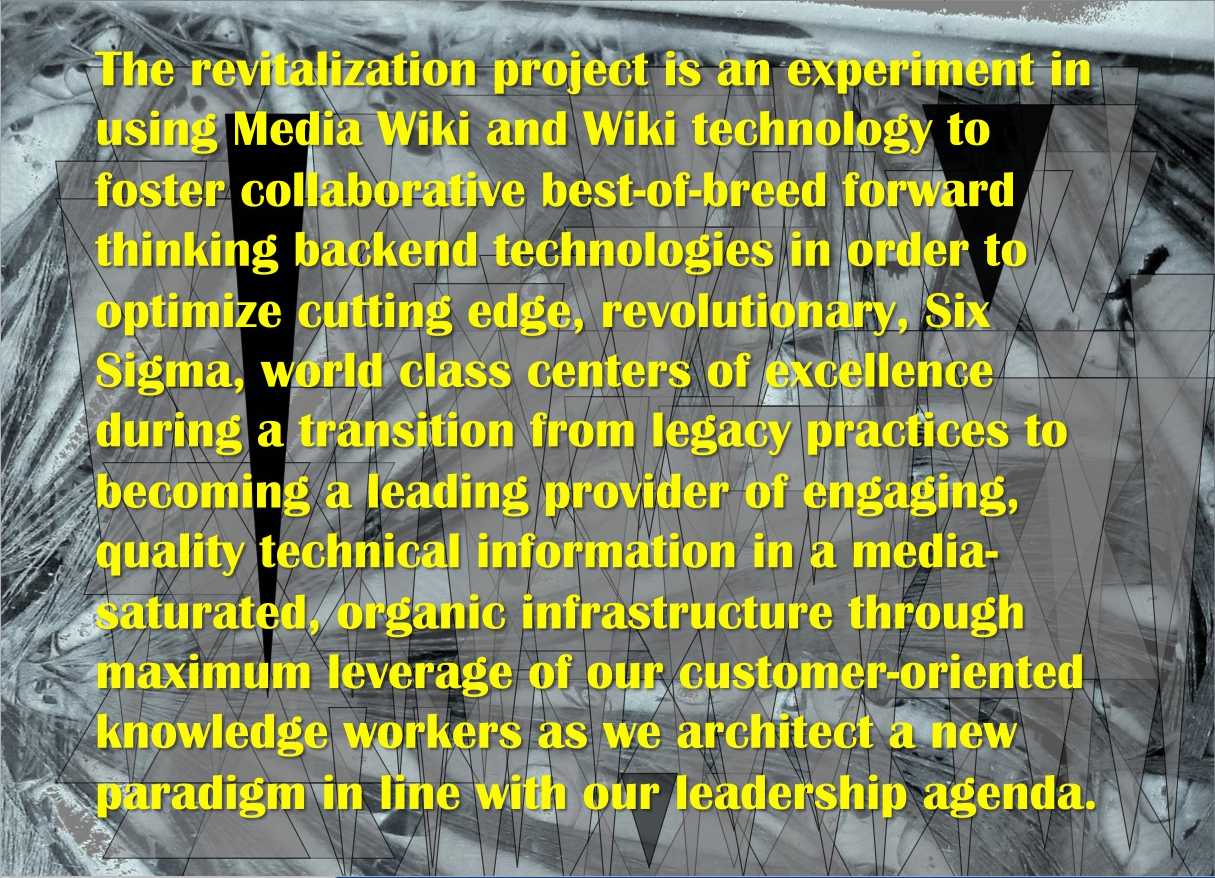
The impossibly complex background, with a ridiculously long, buzzword-saturated mission statement, was intended as a parody. Sadly, management thought it was really cool.
If you take away only one idea from slide:ology, it should be “The default template in PowerPoint …is not a visual aid, it is a document.” (p. 144) Duarte calls the default template a “slideument.” This theme is a call to make a conscious decision about what is the appropriate medium for your message. If you have material that is a report, provide a document as a handout. If you are delivering a message, use enough words “to serve as a mnemonic, but go for a very low word count. If you use a plethora of words, your audience will read the slide more quickly than you can explain it, making you strangely irrelevant to your own presentation.” (p. 144) The corollary is the accompanying tip on page 145, which cautions, “Don’t animate your text unless it adds value, meaning, or emotions to the content.”
Reveal text sequentially to pre-empt your audience from jumping ahead. If you repeat an agenda slide for context, gray out previous text so your audience can visually jump to the current point. “Use a lighter or darker shade of the background color to dim the text.” (p. 145) Duarte recommends taking time to typeset your text using ligatures, kerning, and letterspacing for a professional appearance. Use a single word or phrase to get your point across, as type alone can convey your message.
If you use a block of text, adjust the text box to eliminate a single word by itself at the end of a paragraph (a widow) and create a pleasing shape for the text on the non-aligned side (the rag). If you use bullets, use paragraph spacing between primary bullets (but not sub-bullets, as they should be visually connected to the primary bullet). “Protect your audience from the dangers of bullets...use them sparingly [and] use good design sense to visually compose your bullet slides.” (p. 150) Duarte recommends thinking of bullets as presenting newspaper headlines only. They should be succinct and in parallel structure, so each bullet begins with the same tense and the same part of speech. Whenever possible, avoid the visual complexity of sub-bullets. Use title case for titles and capitalize only the first word of the line for everything else. Consistency is key. Duarte also cautions that using all capital letters may be perceived as shouting.
On page 152, Duarte offers four approaches to validating your font size. My favorite is to put your file into slide sorter view at 66 percent size. If you can read your slides this way, your audience will also be able to read them. The tip warns you not to use smaller than 28 point. Duarte notes that text less than 24 point and third-level bullets are characteristics of a document, not a slide.
Although meaningless animation is discouraged, there are two instances when Duarte recommends using animation effectively. Well-produced animation is effective when waiting for attendees to fill a large venue or “as mini bites of content that play when filler programming is needed.” (p. 154) For an example, go to http://blog.duarte.com/book/ and select 155 Text Animation.
“Using Visual Elements: Images,” focuses on photography and illustration. Duarte provides guidance in determining the right approach for your image. “Photos should work as a cohesive system.” (p. 160) Look for a family of images with similar lighting and color tone. To connect with your audience, present photography that favors realism. The tip on page 160 encourages selection of “images of people that reflect the audience’s culture or ethnicity, are context appropriate, don’t crop their subjects at the neck, represent industry, customer experience, and real life situations [and] account for the current era.” (p. 160) Use the rule of thirds to create aesthetically pleasing and professional-looking imagery: divide your photo into thirds both vertically and horizontally. The crosshairs are called power points. “This helps create a composition that is balanced, possesses energy, and creates interest.” (p. 161) Newer digital cameras may offer a grid system. Duarte recommends turning the grid on and using it to align your shots so the focal point of the image is slightly off-center. “Crop images so they focus on what’s most important.” (p. 161) A case study on pages 162-163 uses a layered concentric diagram as the touchstone of the presentation. The color progression is a visual clue for transition. This is a wonderful example of effectively communicating a plan.
Custom photos can help drive the message home. Duarte suggests thinking about what type of picture tells your story most effectively, then shooting or finding that specific image. The sequence is think, plan, shoot. The tip on page 165 is a well-founded warning to not snag images from the Web. “If your presentation becomes popular online, the owner of the images can insist you pay usage rights. This can be expensive.” (p. 165) The sequence of images on page 165 is a fascinating example of using photos to tell a story. In this example, pie slices are used to explain the fragmented U.S. healthcare system.
Lines are the foundation of an illustration. Duarte recommends choosing lines that support the rest of your design. Be consistent in your overall system, using various line styles for different purposes in the presentation. A tantalizing tip on page 169 notes, “one way to establish dominance is to invest in an art library and then give it away.”
Complex stories may be represented by “infographics,” showing how things work and the interconnectedness of the various parts over time. Duarte provides four pointers on working with a professional illustrator: tell them the story you want represented and let them propose a solution; give them time to research, ideate, and revise; listen to them carefully and trust their input; and consolidate all responses into clear non-conflicting directions.
Duarte identifies a threat to the success of your project: “Untrained and subjective opinions can derail the outcome of a project.” (p. 170)
One tip, dating back to the early days of the Mac, helps you create the professional look you want. “Hold down the Shift key to scale images and objects while preserving their original proportions...Each diagram has its own personality...select illustrations and diagrams that look like they are all created by the same illustrator.” (p. 172)
Another way to get your message across is to use a video slide, which allows you to integrate video into a presentation. You can create short motion clips lasting from a few seconds to a half minute. Video should be “a high enough quality to get the point across, but doesn’t require elaborate staging.” (p. 176) For a dramatic example, see the video case study by going to http://blog.duarte.com/book/ and selecting 176 Incorporating Video. (Note why this example was done in Keynote.)
“Creating Movement,” addresses designing time-based scenes. Duarte notes, “Humans are hard-wired to look when things move.” (p. 180) Since every change creates distraction, every animation affects an audience’s ability to grasp insights. Animation is a key communications strategy, so select animation wisely. “[Animations] should be used only to help an audience process information.” (p. 180) Duarte cautions, “Most presentation animation sucks the life out of the audience instead of breathing life into it...you should identify the places where animation will help you get your point across, and invest planning, thinking, and time into making it powerful.” (p. 182) The tip on page 183 compares the effect of slow-moving animation (creating a feeling of nostalgia or the passage of time) with fast moving animation (creating a sense of excitement, energy, or surprise).
Viewers will read and process visual information the moment it is presented. This can create confusion if the visuals are ahead of what the speaker is saying. “Hide elements until you need to refer to them. This ensures the item being discussed will remain the focus of your audience.” (p. 183) Animation – the use of motion, speed and direction -- should be used for one of five purposes: to show a change in relationship, direction, sequence, emphasis, or object.
The parallel between cinematic storytelling and documentation applies to presentations. You can create a dramatization or a document. Duarte encourages approaching presentations more like a screenwriter than a speechwriter, and recommends looking at Cinematic Storytelling by Jennifer Van Sijll for principles in using visual language to tell stories and evoke audience emotion. “Successful presentation developers not only focus on the content but [are] fluent in conveying what the audience sees on the screen.” (p. 186) Screen direction affects audiences, creating a sense of comfort or discomfort, or giving the impression that movement is easy or difficult.
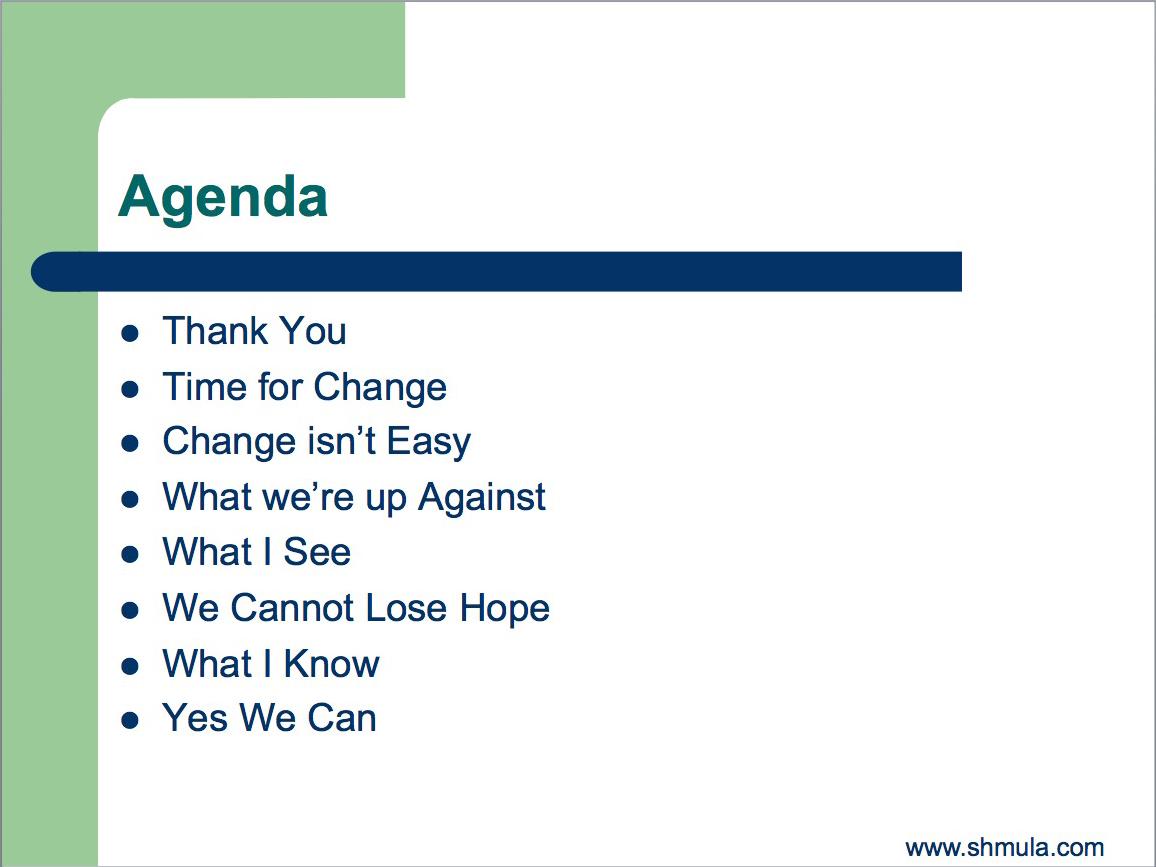
Peter Abilla created a set of PowerPoint slides to show how it can completely strip a presentation of “any life, emotion, inspiration and meaning.” To illustrate his point, he took Barack Obama’s “A More Perfect Union” campaign speech, better known as the “Yes We Can” speech, and reproduced it as a slide deck. (http://www.shmula.com/) Click on image to view full-sized.
Animation choices “influence how much the audience has to move their eyes to process the information. Objects animate to perform specific actions...Plan out what pacing makes sense, where objects will travel, and where the object is at in space.” (p. 188) When you need to split content between two slides you can connect them to each other using the push transition to create an illusion that the content is all in the same scene. To use this technique, Duarte advocates using a template that is free from all ornamentation. There are two excellent examples on pages 192-193.
As for graphics, no word-based approach gives the freedom to tell the story without being forced to address every item on a bullet point slide. See the clever example on page 195, where the perspective pulls back to reveal the bigger picture or go to http://blog.duarte.com/book/ and select 195 The Sum of its Parts. Brainstorming is a way to come up with meaningful metaphor. For an example see pages 196-197 or go to http://blog.duarte.com/book/ and select 197 Combination Lock. The case study on pages 198-199 provides an example of a localized culturally relevant message where the process is presented as a journey. Go to http://blog.duarte.com/book/ and select 198 All the World’s a Stage. Animation done well is a powerful communication tool. Animation used the wrong way is an obstacle to communication. “Just because an animation feature is in an application doesn’t mean you have to use it.” (p. 200) Duarte lists eight ways to know you’re using animation wrong on page 200.
"Governing with Templates" provides an organizational perspective, but many of the points are relevant for individuals as well. Duarte sees a template as a basic shell for words and images. “It shouldn’t be a stand alone work of art.” (p. 206) The tip on page 207 suggests you talk with your IT department before developing a template. Ask about their migration plan for the presentation application. If the template is loaded with images, ask whether there is adequate storage and network bandwidth.
“Interacting with Slides” should be required reading for everyone. “You are in a codependent relationship with your slides if you are desperately addicted to them and unable to break away.” (p. 218) Slides are not the stars of the show; they provide the context and setting in which you give a memorable performance. Duarte provides the three Rs of letting go: reduce, record, repeat. Using this methodology allows you to use your presentation to make a connection with your audience, rather than make it a presentation focused on slides. Duarte presents some interesting approaches, such as “a quick paced presentation format of 20 slides each displayed for 20 seconds” which results in a six minute forty second presentation (p. 228). Another interesting approach is to give the audience a visual pause during a slideshow by pressing the “B” key to turn the screen black. This forces the audience to focus on you. An alternative is to press the “W” key to turn the screen white; these shortcuts work in either PowerPoint or Keynote.
Duarte offers a sobering word of caution: “Just because your slides look great does not mean they convey useful meaning...your top concern should be how well you communicate.” (p. 233) One way of constraining your slides is to apply the 10/20/30 rule: 10 slides last no longer than 20 minutes and contain no font smaller than 30 points. Another approach is to “use as many slides as you need to get your point across...stick with one point per slide.” (p. 236) She also addresses using larger point sizes when converting your presentation to a device like an iPhone, where 24-point type reduces to 4-point type.
A powerful case study on pages 246-247 reinforces the idea “You don’t need a ton of slides to create a memorable presentation.” Go to:
http://www.ted.com/index.php/talks/jill_bolte_taylor_s_powerful_stroke_of_insight.html
for an account of a neuroanatomist experiencing her own stroke, and see the power of a presentation focused on the connection between the audience and the speaker, not the slides. Duarte reminds us, “You need to come across as a real person, and presentation applications don’t inherently facilitate this.” (p. 248) “The healthiest relationship to have with your slides is one of interdependence.” (p. 249) If your audience feels like they have been enlightened, moved to act, or made willing to change their behavior, you’ve been successful. Duarte encourages presenters to take the audience on a journey, to show them something they have never seen before. “Employ great stories, reveal convincing information, and communicate in your own, genuinely human way.” (p. 249)
Duarte offers seven questions to answer before beginning a presentation: “1) What are they like? 2) Why are they here? 3) What keeps them up at night? 4) How can you solve their problem? 5) What do you want them to do? 6) How might they resist? 7) How can you best reach them?” It takes time to create a presentation that addresses these points. The time estimate for a one-hour presentation consisting of 30 slides is 36-90 hours total (for a breakdown of hours by task see p. 13). The payoff is dramatic, as evidenced by the case studies.
The works cited in slide:ology make a first class library.
| Topic | Work cited | Citation |
|---|---|---|
| Communicating well visually | Go Put Your Strengths to Work | p. 3 |
| Using media appropriately | Really Bad PowerPoint | p. 6 |
| The presentation development process | The Presentation Survival Skills Guide | p. 10 |
| Content development methodology | Beyond Bullet Points | p. 28 |
| Data visualization | Show Me the Numbers; Information Dashboard Design; Visual Explanations; Envisioning Information; The Visual Display of Quantitative Information; and Data Analysis for Politics and Policy | p. 67 |
| Cognitive strain | Presentation Zen | p. 89 |
| How information is processed | Presenting to Win | p. 96 |
| Meaning from location | Visual Language | p. 105 |
| Style | Chicago Manual of Style; Words into Type | p. 150 |
| Use of bullets | The Power Presenter | p. 151 |
| Principles of film language | Cinematic Storytelling | p. 186 |
| Storytelling | Making Comics | p. 236 |
| The changing world of work | Free Agent Nation: The Future of Working for Yourself;A Whole New Mind: Why Right-Brainers Will Ruler the Future; and The Adventures of Johnny Bunko: The Last Career Guide You’ll Ever Need | p. 238 |
The useful References section (pp. 262-263) has seven topics: design, branding, visual thinking, information graphics, data display, content, and business books.
This book is a marvelous reference guide. I will keep it close and refer to it frequently for guidance and inspiration. I will adopt and live the manifesto. My colleagues, and those who view my presentations, will be the benefactors.
Nancy Duarte, slide:ology: The Art and Science of Creating Great Presentations. O’Reilly, 2008. 294 pp., $34.99. ISBN-13: 978-0-596-52234-6
http://oreilly.com/catalog/9780596522346/